2.10 Exercises
2.10.1 Computations in R
Sum 2 and 3 using the
+operator. [Difficulty: Beginner]Take the square root of 36, use
sqrt(). [Difficulty: Beginner]Take the log10 of 1000, use function
log10(). [Difficulty: Beginner]Take the log2 of 32, use function
log2(). [Difficulty: Beginner]Assign the sum of 2,3 and 4 to variable x. [Difficulty: Beginner]
Find the absolute value of the expression
5 - 145using theabs()function. [Difficulty: Beginner]Calculate the square root of 625, divide it by 5, and assign it to variable
x.Ex:y= log10(1000)/5, the previous statement takes log10 of 1000, divides it by 5, and assigns the value to variable y. [Difficulty: Beginner]Multiply the value you get from previous exercise by 10000, assign it to variable x Ex:
y=y*5, multipliesyby 5 and assigns the value toy. KEY CONCEPT: results of computations or arbitrary values can be stored in variables we can re-use those variables later on and over-write them with new values. [Difficulty: Beginner]
2.10.2 Data structures in R
Make a vector of 1,2,3,5 and 10 using
c(), and assign it to thevecvariable. Ex:vec1=c(1,3,4)makes a vector out of 1,3,4. [Difficulty: Beginner]Check the length of your vector with length(). Ex:
length(vec1)should return 3. [Difficulty: Beginner]Make a vector of all numbers between 2 and 15. Ex:
vec=1:6makes a vector of numbers between 1 and 6, and assigns it to thevecvariable. [Difficulty: Beginner]Make a vector of 4s repeated 10 times using the
rep()function. Ex:rep(x=2,times=5)makes a vector of 2s repeated 5 times. [Difficulty: Beginner]Make a logical vector with TRUE, FALSE values of length 4, use
c(). Ex:c(TRUE,FALSE). [Difficulty: Beginner]Make a character vector of the gene names PAX6,ZIC2,OCT4 and SOX2. Ex:
avec=c("a","b","c")makes a character vector of a,b and c. [Difficulty: Beginner]Subset the vector using
[]notation, and get the 5th and 6th elements. Ex:vec1[1]gets the first element.vec1[c(1,3)]gets the 1st and 3rd elements. [Difficulty: Beginner]You can also subset any vector using a logical vector in
[]. Run the following:
myvec=1:5
# the length of the logical vector
# should be equal to length(myvec)
myvec[c(TRUE,TRUE,FALSE,FALSE,FALSE)]
myvec[c(TRUE,FALSE,FALSE,FALSE,TRUE)]
[Difficulty: Beginner]
==,>,<, >=, <=operators create logical vectors. See the results of the following operations:
[Difficulty: Beginner]
Use the
>operator inmyvec[ ]to get elements larger than 2 inmyvecwhich is described above. [Difficulty: Beginner]Make a 5x3 matrix (5 rows, 3 columns) using
matrix(). Ex:matrix(1:6,nrow=3,ncol=2)makes a 3x2 matrix using numbers between 1 and 6. [Difficulty: Beginner]What happens when you use
byrow = TRUEin your matrix() as an additional argument? Ex:mat=matrix(1:6,nrow=3,ncol=2,byrow = TRUE). [Difficulty: Beginner]Extract the first 3 columns and first 3 rows of your matrix using
[]notation. [Difficulty: Beginner]Extract the last two rows of the matrix you created earlier. Ex:
mat[2:3,]ormat[c(2,3),]extracts the 2nd and 3rd rows. [Difficulty: Beginner]Extract the first two columns and run
class()on the result. [Difficulty: Beginner]Extract the first column and run
class()on the result, compare with the above exercise. [Difficulty: Beginner]Make a data frame with 3 columns and 5 rows. Make sure first column is a sequence of numbers 1:5, and second column is a character vector. Ex:
df=data.frame(col1=1:3,col2=c("a","b","c"),col3=3:1) # 3x3 data frame. Remember you need to make a 3x5 data frame. [Difficulty: Beginner]Extract the first two columns and first two rows. HINT: Use the same notation as matrices. [Difficulty: Beginner]
Extract the last two rows of the data frame you made. HINT: Same notation as matrices. [Difficulty: Beginner]
Extract the last two columns using the column names of the data frame you made. [Difficulty: Beginner]
Extract the second column using the column names. You can use
[]or$as in lists; use both in two different answers. [Difficulty: Beginner]Extract rows where the 1st column is larger than 3. HINT: You can get a logical vector using the
>operator , and logical vectors can be used in[]when subsetting. [Difficulty: Beginner]Extract rows where the 1st column is larger than or equal to 3. [Difficulty: Beginner]
Convert a data frame to the matrix. HINT: Use
as.matrix(). Observe what happens to numeric values in the data frame. [Difficulty: Beginner]Make a list using the
list()function. Your list should have 4 elements; the one below has 2. Ex:mylist= list(a=c(1,2,3),b=c("apple,"orange"))[Difficulty: Beginner]Select the 1st element of the list you made using
$notation. Ex:mylist$aselects first element named “a”. [Difficulty: Beginner]Select the 4th element of the list you made earlier using
$notation. [Difficulty: Beginner]Select the 1st element of your list using
[ ]notation. Ex:mylist[1]selects the first element named “a”, and you get a list with one element.mylist["a"]selects the first element named “a”, and you get a list with one element. [Difficulty: Beginner]Select the 4th element of your list using
[ ]notation. [Difficulty: Beginner]Make a factor using factor(), with 5 elements. Ex:
fa=factor(c("a","a","b")). [Difficulty: Beginner]Convert a character vector to a factor using
as.factor(). First, make a character vector usingc()then useas.factor(). [Difficulty: Intermediate]Convert the factor you made above to a character using
as.character(). [Difficulty: Beginner]
2.10.3 Reading in and writing data out in R
- Read CpG island (CpGi) data from the compGenomRData package
CpGi.table.hg18.txt. This is a tab-separated file. Store it in a variable calledcpgi. Use
cpgFilePath=system.file("extdata",
                "CpGi.table.hg18.txt",
                package="compGenomRData")
to get the file path within the installed compGenomRData package. [Difficulty: Beginner]
Use
head()on CpGi to see the first few rows. [Difficulty: Beginner]Why doesn’t the following work? See
separgument athelp(read.table). [Difficulty: Beginner]
cpgtFilePath=system.file("extdata",
                "CpGi.table.hg18.txt",
                package="compGenomRData")
cpgtFilePath
cpgiSepComma=read.table(cpgtFilePath,header=TRUE,sep=",")
head(cpgiSepComma)- What happens when you set
stringsAsFactors=FALSEinread.table()? [Difficulty: Beginner]
cpgiHF=read.table("intro2R_data/data/CpGi.table.hg18.txt",
                     header=FALSE,sep="\t",
                     stringsAsFactors=FALSE)
Read only the first 10 rows of the CpGi table. [Difficulty: Beginner/Intermediate]
Use
cpgFilePath=system.file("extdata","CpGi.table.hg18.txt",package="compGenomRData")to get the file path, then useread.table()with argumentheader=FALSE. Usehead()to see the results. [Difficulty: Beginner]Write CpG islands to a text file called “my.cpgi.file.txt”. Write the file to your home folder; you can use
file="~/my.cpgi.file.txt"in linux.~/denotes home folder.[Difficulty: Beginner]Same as above but this time make sure to use the
quote=FALSE,sep="\t"androw.names=FALSEarguments. Save the file to “my.cpgi.file2.txt” and compare it with “my.cpgi.file.txt”. [Difficulty: Beginner]Write out the first 10 rows of the
cpgidata frame. HINT: Use subsetting for data frames we learned before. [Difficulty: Beginner]Write the first 3 columns of the
cpgidata frame. [Difficulty: Beginner]Write CpG islands only on chr1. HINT: Use subsetting with
[], feed a logical vector using==operator.[Difficulty: Beginner/Intermediate]Read two other data sets “rn4.refseq.bed” and “rn4.refseq2name.txt” with
header=FALSE, and assign them to df1 and df2 respectively. They are again included in the compGenomRData package, and you can use thesystem.file()function to get the file paths. [Difficulty: Beginner]Use
head()to see what is inside the data frames above. [Difficulty: Beginner]Merge data sets using
merge()and assign the results to a variable named ‘new.df’, and usehead()to see the results. [Difficulty: Intermediate]
2.10.4 Plotting in R
Please run the following code snippet for the rest of the exercises.
Make a scatter plot using the
x1andy1vectors generated above. [Difficulty: Beginner]Use the
mainargument to give a title toplot()as inplot(x,y,main="title"). [Difficulty: Beginner]Use the
xlabargument to set a label for the x-axis. Useylabargument to set a label for the y-axis. [Difficulty: Beginner]Once you have the plot, run the following expression in R console.
mtext(side=3,text="hi there")does. HINT:mtextstands for margin text. [Difficulty: Beginner]See what
mtext(side=2,text="hi there")does. Check your plot after execution. [Difficulty: Beginner]Use mtext() and paste() to put a margin text on the plot. You can use
paste()as ‘text’ argument inmtext(). HINT:mtext(side=3,text=paste(...)). See howpaste()is used for below. [Difficulty: Beginner/Intermediate]
## [1] "Text here"## [1] "Text here"cor()calculates the correlation between two vectors. Pearson correlation is a measure of the linear correlation (dependence) between two variables X and Y. Try using thecor()function on thex1andy1variables. [Difficulty: Intermediate]Try to use
mtext(),cor()andpaste()to display the correlation coefficient on your scatter plot. [Difficulty: Intermediate]Change the colors of your plot using the
colargument. Ex:plot(x,y,col="red"). [Difficulty: Beginner]Use
pch=19as an argument in yourplot()command. [Difficulty: Beginner]Use
pch=18as an argument to yourplot()command. [Difficulty: Beginner]Make a histogram of
x1with thehist()function. A histogram is a graphical representation of the data distribution. [Difficulty: Beginner]You can change colors with ‘col’, add labels with ‘xlab’, ‘ylab’, and add a ‘title’ with ‘main’ arguments. Try all these in a histogram. [Difficulty: Beginner]
Make a boxplot of y1 with
boxplot().[Difficulty: Beginner]Make boxplots of
x1andy1vectors in the same plot.[Difficulty: Beginner]In boxplot, use the
horizontal = TRUEargument. [Difficulty: Beginner]Make multiple plots with
par(mfrow=c(2,1))- run
par(mfrow=c(2,1)) - make a boxplot
- make a histogram [Difficulty: Beginner/Intermediate]
- run
Do the same as above but this time with
par(mfrow=c(1,2)). [Difficulty: Beginner/Intermediate]Save your plot using the “Export” button in Rstudio. [Difficulty: Beginner]
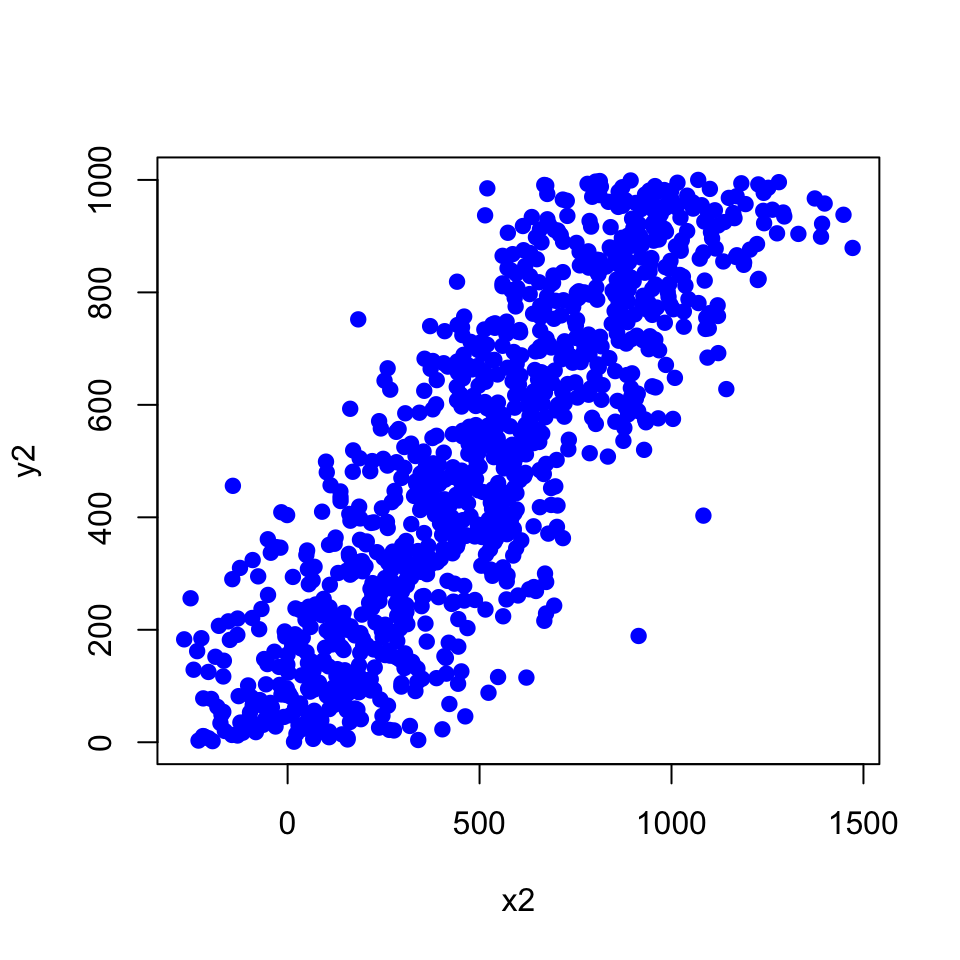
You can make a scatter plot showing the density of points rather than points themselves. If you use points it looks like this:
If you use the smoothScatter() function, you get the densities.
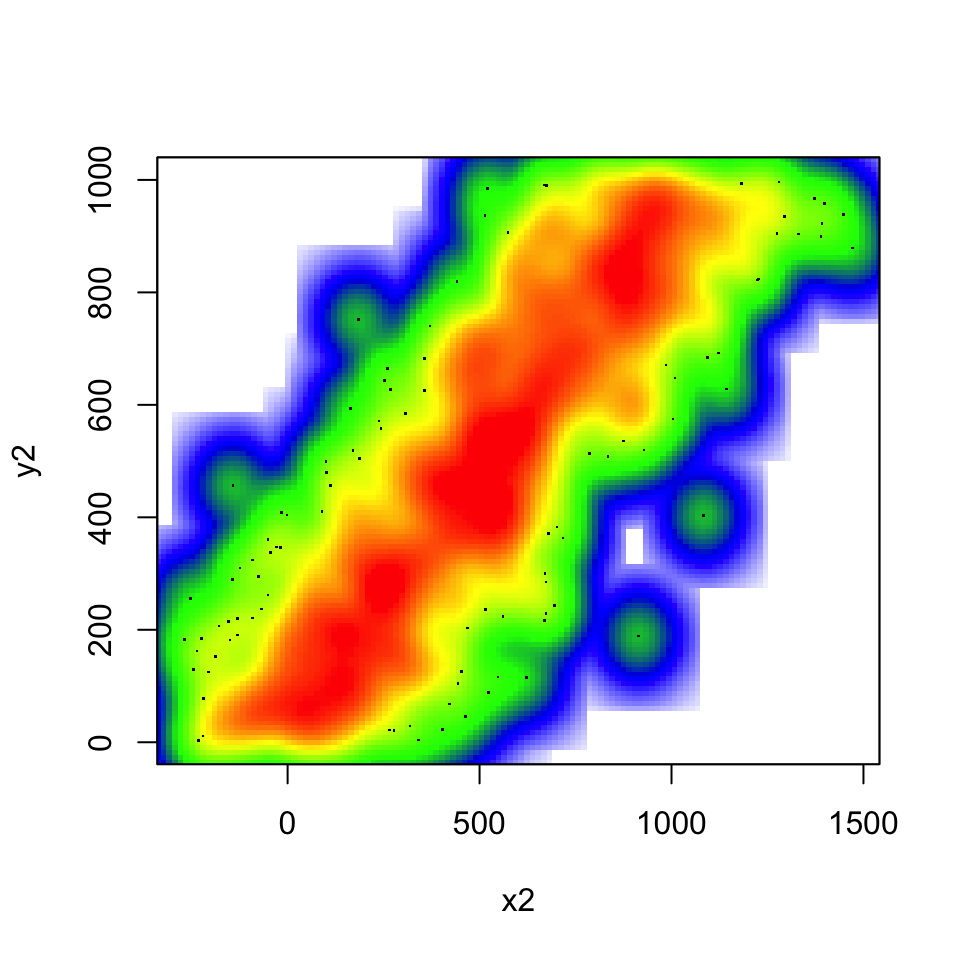
Now, plot with the colramp=heat.colors argument and then use a custom color scale using the following argument.
colramp = colorRampPalette(c("white","blue", "green","yellow","red")))[Difficulty: Beginner/Intermediate]
2.10.5 Functions and control structures (for, if/else, etc.)
Read CpG island data as shown below for the rest of the exercises.
cpgtFilePath=system.file("extdata",
                "CpGi.table.hg18.txt",
                package="compGenomRData")
cpgi=read.table(cpgtFilePath,header=TRUE,sep="\t")
head(cpgi)
## chrom chromStart chromEnd name length cpgNum gcNum perCpg perGc obsExp
## 1 chr1 18598 19673 CpG: 116 1075 116 787 21.6 73.2 0.83
## 2 chr1 124987 125426 CpG: 30 439 30 295 13.7 67.2 0.64
## 3 chr1 317653 318092 CpG: 29 439 29 295 13.2 67.2 0.62
## 4 chr1 427014 428027 CpG: 84 1013 84 734 16.6 72.5 0.64
## 5 chr1 439136 440407 CpG: 99 1271 99 777 15.6 61.1 0.84
## 6 chr1 523082 523977 CpG: 94 895 94 570 21.0 63.7 1.04Check values in the perGc column using a histogram. The ‘perGc’ column in the data stands for GC percent => percentage of C+G nucleotides. [Difficulty: Beginner]
Make a boxplot for the ‘perGc’ column. [Difficulty: Beginner]
Use if/else structure to decide if the given GC percent is high, low or medium. If it is low, high, or medium: low < 60, high>75, medium is between 60 and 75; use greater or less than operators,
<or>. Fill in the values in the code below, where it is written ‘YOU_FILL_IN’. [Difficulty: Intermediate]
GCper=65

  # check if GC value is lower than 60,
  # assign "low" to result
  if('YOU_FILL_IN'){
    result="low"
    cat("low")
  }
  else if('YOU_FILL_IN'){  # check if GC value is higher than 75,
                           #assign "high" to result
    result="high"
    cat("high")
  }else{ # if those two conditions fail then it must be "medium"
    result="medium"
  }

result- Write a function that takes a value of GC percent and decides if it is low, high, or medium: low < 60, high>75, medium is between 60 and 75. Fill in the values in the code below, where it is written ‘YOU_FILL_IN’. [Difficulty: Intermediate/Advanced]
GCclass<-function(my.gc){

  YOU_FILL_IN

  return(result)
}
GCclass(10) # should return "low"
GCclass(90) # should return "high"
GCclass(65) # should return "medium"- Use a for loop to get GC percentage classes for
gcValuesbelow. Use the function you wrote above.[Difficulty: Intermediate/Advanced]
gcValues=c(10,50,70,65,90)
for( i in YOU_FILL_IN){
  YOU_FILL_IN
}- Use
lapplyto get GC percentage classes forgcValues. [Difficulty: Intermediate/Advanced]
Use sapply to get values to get GC percentage classes for
gcValues. [Difficulty: Intermediate]Is there a way to decide on the GC percentage class of a given vector of
GCpercentageswithout using if/else structure and loops ? if so, how can you do it? HINT: Subsetting using < and > operators. [Difficulty: Intermediate]