11.3 Matrix factorization methods for unsupervised multi-omics data integration
Matrix factorization techniques attempt to infer a set of latent variables from the data by finding factors of a data matrix. Principal Component Analysis (introduced in Chapter 4) is a form of matrix factorization which finds factors based on the covariance structure of the data. Generally, matrix factorization methods may be formulated as
\[ X = WH, \] where \(X\) is the data matrix, \([M \times N]\) where \(M\) is the number of features (typically genes), and \(N\) is the number of samples. \(W\) is an \([M \times K]\) factors matrix, and \(H\) is the \([K \times N]\) latent variable coefficient matrix. Tying this back to PCA, where \(X = U \Sigma V^T\), we may formulate the factorization in the same terms by setting \(W=U\Sigma\) and \(H=V^T\). If \(K=rank(X)\), this factorization is lossless, i.e. \(X=WH\). However if we choose \(K<rank(X)\), the factorization is lossy, i.e. \(X \approx WH\). In that case, matrix factorization methods normally opt to minimize the error
\[ min~\|X-WH\|. \] As we normally seek a latent variable model with a considerably lower dimensionality than \(X\), this is the more common case.
The loss function we choose to minimize may be further subject to some constraints or regularization terms. Regularization has been introduced in Chapter 5. In the current context of latent factor models, a regularization term might be added to the loss function, i.e. we might choose to minimize \(min~\|X-WH\| + \lambda \|W\|^2\) (this is called \(L_2\)-regularization) instead of merely the reconstruction error. Adding such a term to our loss function here will push the \(W\) matrix entries towards 0, in effect balancing between better reconstruction of the data and a more parsimonious model. A more parsimonious latent factor model is one with more sparsity in the latent factors. This sparsity is desirable for model interpretation, as will become evident in later sections.
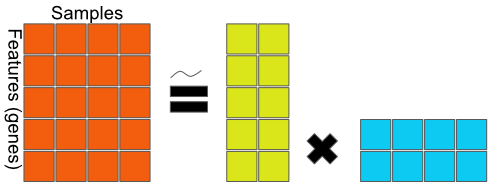
FIGURE 11.4: General matrix factorization framework. The data matrix on the left-hand side is decomposed into factors on the right-hand side. The equality may be an approximation as some matrix factorization methods are lossless (exact), while others are an approximation.
In Figure 11.4, the \(5 \times 4\) data matrix \(X\) is decomposed to a 2-dimensional latent variable model.
11.3.1 Multiple factor analysis
Multiple factor analysis is a natural starting point for a discussion about matrix factorization methods for integrating multiple data types. It is a straightforward extension of PCA into the domain of multiple data types.2
Figure 11.5 sketches a naive extension of PCA to a multi-omics context.
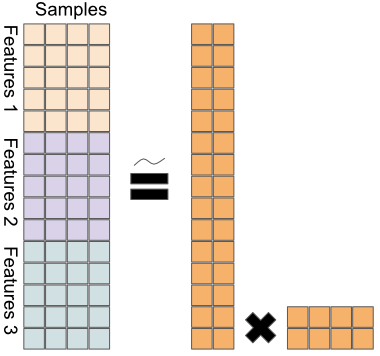
FIGURE 11.5: A naive extension of PCA to multi-omics; data matrices from different platforms are stacked, before applying PCA.
Formally, we have \[ X = \begin{bmatrix} X_{1} \\ X_{2} \\ \vdots \\ X_{L} \end{bmatrix} = WH, \] a joint decomposition of the different data matrices (\(X_i\)) into the factor matrix \(W\) and the latent variable matrix \(H\). This way, we can leverage the ability of PCA to find the highest variance decomposition of the data, when the data consists of different omics types. As a reminder, PCA finds the linear combinations of the features which, when the data is projected onto them, preserve the most variance of any \(K\)-dimensional space. But because measurements from different experiments have different scales, they will also have variance (and co-variance) at different scales.
Multiple Factor Analysis addresses this issue and achieves balance among the data types by normalizing each of the data types, before stacking them and passing them on to PCA. Formally, MFA is given by
\[ X_n = \begin{bmatrix} X_{1} / \lambda^{(1)}_1 \\ X_{2} / \lambda^{(2)}_1 \\ \vdots \\ X_{L} / \lambda^{(L)}_1 \end{bmatrix} = WH, \] where \(\lambda^{(i)}_1\) is the first eigenvalue of the principal component decomposition of \(X_i\).
Following this normalization step, we apply PCA to \(X_n\). From there on, MFA analysis is the same as PCA analysis, and we refer the reader to Chapter 4 for more details.
11.3.1.1 MFA in R
MFA is available through the CRAN package FactoMineR. The code snippet below shows how to run it:
# run the MFA function from the FactoMineR package
r.mfa <- FactoMineR::MFA(
  t(rbind(x1,x2,x3)), # binding the omics types together
  c(dim(x1)[1], dim(x2)[1], dim(x3)[1]), # specifying the dimensions of each
  graph=FALSE)
Since this generates a two-dimensional factorization of the multi-omics data, we can now plot each tumor as a dot in a 2D scatter plot to see how well the MFA factors separate the cancer subtypes. The following code snippet generates Figure 11.6:
# first, extract the H and W matrices from the MFA run result
mfa.h <- r.mfa$global.pca$ind$coord
mfa.w <- r.mfa$quanti.var$coord

# create a dataframe with the H matrix and the CMS label
mfa_df <- as.data.frame(mfa.h)
mfa_df$subtype <- factor(covariates[rownames(mfa_df),]$cms_label)

# create the plot
ggplot2::ggplot(mfa_df, ggplot2::aes(x=Dim.1, y=Dim.2, color=subtype)) +
ggplot2::geom_point() + ggplot2::ggtitle("Scatter plot of MFA")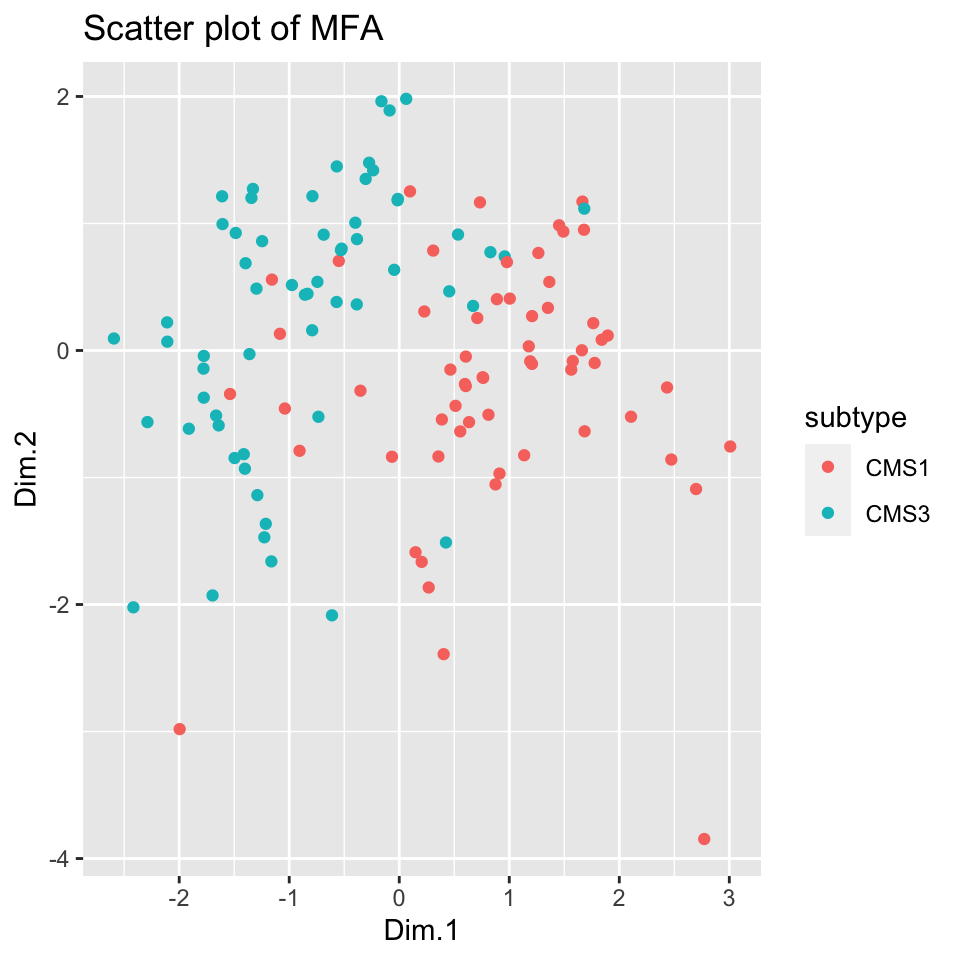
FIGURE 11.6: Scatter plot of 2-dimensional MFA for multi-omics data shows separation between the subtypes.
Figure 11.6 shows remarkable separation between the cancer subtypes; it is easy enough to draw a line separating the tumors to CMS subtypes with good accuracy.
Another way to examine the MFA factors, which is also useful for factor models with more than two components, is a heatmap, as shown in Figure 11.7, generated by the following code snippet:
pheatmap::pheatmap(t(mfa.h)[1:2,], annotation_col = anno_col,
                  show_colnames = FALSE,
                  main="MFA for multi-omics integration")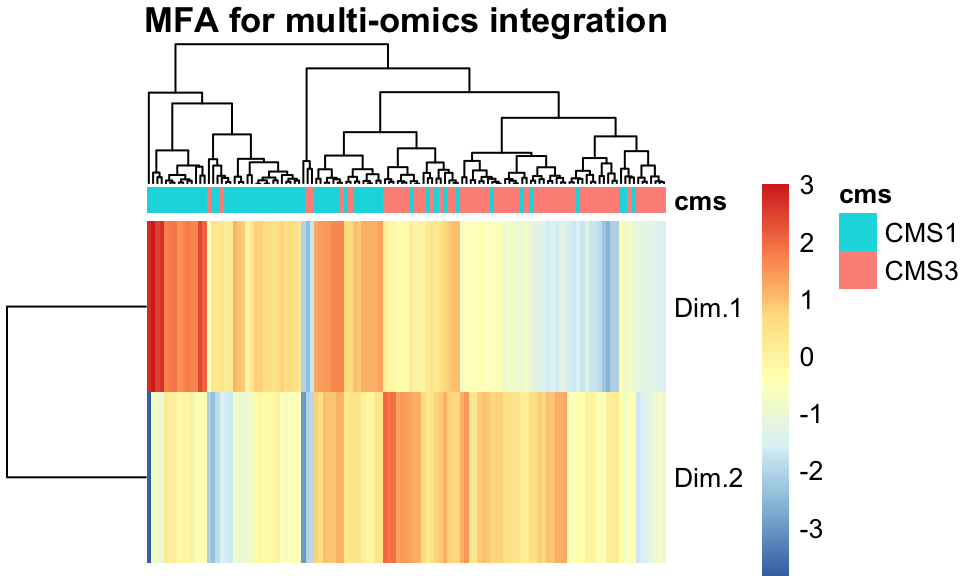
FIGURE 11.7: A heatmap of the two MFA components shows separation between the cancer subtypes.
Figure 11.7 shows that indeed, when tumors are clustered and ordered using the two MFA factors we learned above, their separation into CMS clusters is nearly trivial.
Want to know more ?
- Learn more about FactoMineR on the website: http://factominer.free.fr/
- Learn more about MFA on the Wikipedia page https://en.wikipedia.org/wiki/Multiple_factor_analysis
11.3.2 Joint non-negative matrix factorization
As introduced in Chapter 4, NMF (Non-negative Matrix Factorization) is an algorithm from 2000 that seeks to find a non-negative additive decomposition for a non-negative data matrix. It takes the familiar form \(X \approx WH\), with \(X \ge 0\), \(W \ge 0\), and \(H \ge 0\). The non-negative constraints make a lossless decomposition (i.e. \(X=WH\)) generally impossible. Hence, NMF attempts to find a solution which minimizes the Frobenius norm of the reconstruction:
\[ min~\|X-WH\|_F \\ W \ge 0, \\ H \ge 0, \]
where the Frobenius norm \(\|\cdot\|_F\) is the matrix equivalent of the Euclidean distance:
\[ \|X\|_F = \sqrt{\sum_i\sum_jx_{ij}^2}. \]
This is typically solved for \(W\) and \(H\) using random initializations followed by iterations of a multiplicative update rule:
\[\begin{align} W_{t+1} &= W_t^T \frac{XH_t^T}{XH_tH_t^T} \\ H_{t+1} &= H_t \frac{W_t^TX}{W^T_tW_tX}. \end{align}\]
Since this algorithm is guaranteed only to converge to a local minimum, it is typically run several times with random initializations, and the best result is kept.
In the multi-omics context, we will, as in the MFA case, wish to find a decomposition for an integrated data matrix of the form
\[ X = \begin{bmatrix} X_{1} \\ X_{2} \\ \vdots \\ X_{L} \end{bmatrix}, \]
with \(X_i\)s denoting data from different omics platforms.
As NMF seeks to minimize the reconstruction error \(\|X-WH\|_F\), some care needs to be taken with regards to data normalization. Different omics platforms may produce data with different scales (i.e. real-valued gene expression quantification, binary mutation data, etc.), and so will have different baseline Frobenius norms. To address this, when doing Joint NMF, we first feature-normalize each data matrix, and then normalize by the Frobenius norm of the data matrix. Formally, we run NMF on
\[ X = \begin{bmatrix} X_{1}^N / \alpha_1 \\ X_{2}^N / \alpha_2 \\ \vdots \\ X_{L}^N / \alpha_L \end{bmatrix}, \]
where \(X_i^N\) is the feature-normalized data matrix \(X_i^N = \frac{x^{ij}}{\sum_jx^{ij}}\), and \(\alpha_i = \|X_{i}^N\|_F\).
Another consideration with NMF is the non-negativity constraint. Different omics data types may have negative values, for instance, copy-number variations (CNVs) may be positive, indicating gains, or negative, indicating losses, as in Table 11.4. In order to turn such data into a non-negative form, we will split each feature into two features, one new feature holding all the non-negative values of the original feature, and another feature holding the absolute value of the negative ones, as in Table 11.5.
| seg1 | seg2 | |
|---|---|---|
| samp1 | 1 | 0 |
| samp2 | 2 | 1 |
| samp3 | 1 | -2 |
| seg1+ | seg1- | seg2+ | seg2- | |
|---|---|---|---|---|
| samp1 | 1 | 0 | 0 | 0 |
| samp2 | 2 | 0 | 1 | 0 |
| samp3 | 1 | 0 | 0 | 2 |
11.3.2.1 NMF in R
Many NMF algorithms are available through the CRAN package NMF. The following code chunk demonstrates how it may be run:
# Feature-normalize the data
x1.featnorm <- x1 / rowSums(x1)
x2.featnorm <- x2 / rowSums(x2)
x3.featnorm <- x3 / rowSums(x3)

# Normalize by each omics type's frobenius norm
x1.featnorm.frobnorm <- x1.featnorm / norm(as.matrix(x1.featnorm), type="F")
x2.featnorm.frobnorm <- x2.featnorm / norm(as.matrix(x2.featnorm), type="F")
x3.featnorm.frobnorm <- x3.featnorm / norm(as.matrix(x3.featnorm), type="F")

# Split the features of the CNV matrix into two non-negative features each
x3.featnorm.frobnorm.nonneg <- t(split_neg_columns(t(x3.featnorm.frobnorm)))

# run the nmf function from the NMF package
require(NMF)
## Warning: package 'NMF' was built under R version 4.0.2r.nmf <- nmf(t(rbind(x1.featnorm.frobnorm,
x2.featnorm.frobnorm,
x3.featnorm.frobnorm.nonneg)),
2,
method='Frobenius')
# exctract the H and W matrices from the nmf run result
nmf.h <- NMF::basis(r.nmf)
nmf.w <- NMF::coef(r.nmf)
nmfw <- t(nmf.w)As with MFA, we can examine how well 2-factor NMF splits tumors into subtypes by looking at the scatter plot in Figure 11.8, generated by the following code chunk:
# create a dataframe with the H matrix and the CMS label (subtype)
nmf_df <- as.data.frame(nmf.h)
colnames(nmf_df) <- c("dim1", "dim2")
nmf_df$subtype <- factor(covariates[rownames(nmf_df),]$cms_label)

# create the scatter plot
ggplot2::ggplot(nmf_df, ggplot2::aes(x=dim1, y=dim2, color=subtype)) +
ggplot2::geom_point() +
ggplot2::ggtitle("Scatter plot of 2-component NMF for multi-omics integration")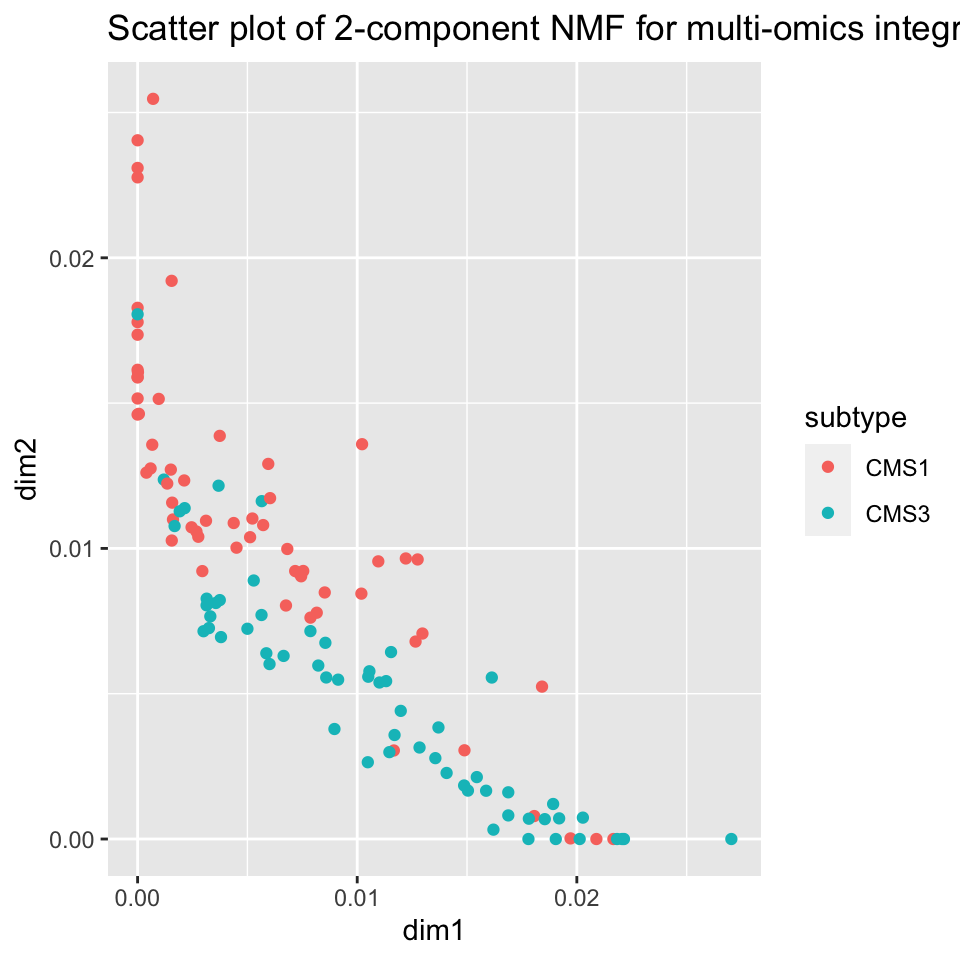
FIGURE 11.8: NMF creates a disentangled representation of the data using two components which allow for separation between tumor sub-types CMS1 and CMS3 based on NMF factors learned from multi-omics data.
Figure 11.8 shows an important difference between NMF and MFA (PCA). It shows the tendency of samples to lie close to the X or Y axes, that is, the tendency of each sample to be high in only one of the factors. This will be discussed more in the later section on disentangledness.
Again, should we choose to run NMF with more than two factors, a more useful plot might be the heatmap shown in Figure 11.9, generated by the following code snippet:
pheatmap::pheatmap(t(nmf_df[,1:2]),
                   annotation_col = anno_col,
                   show_colnames=FALSE,
                   main="Heatmap of 2-component NMF")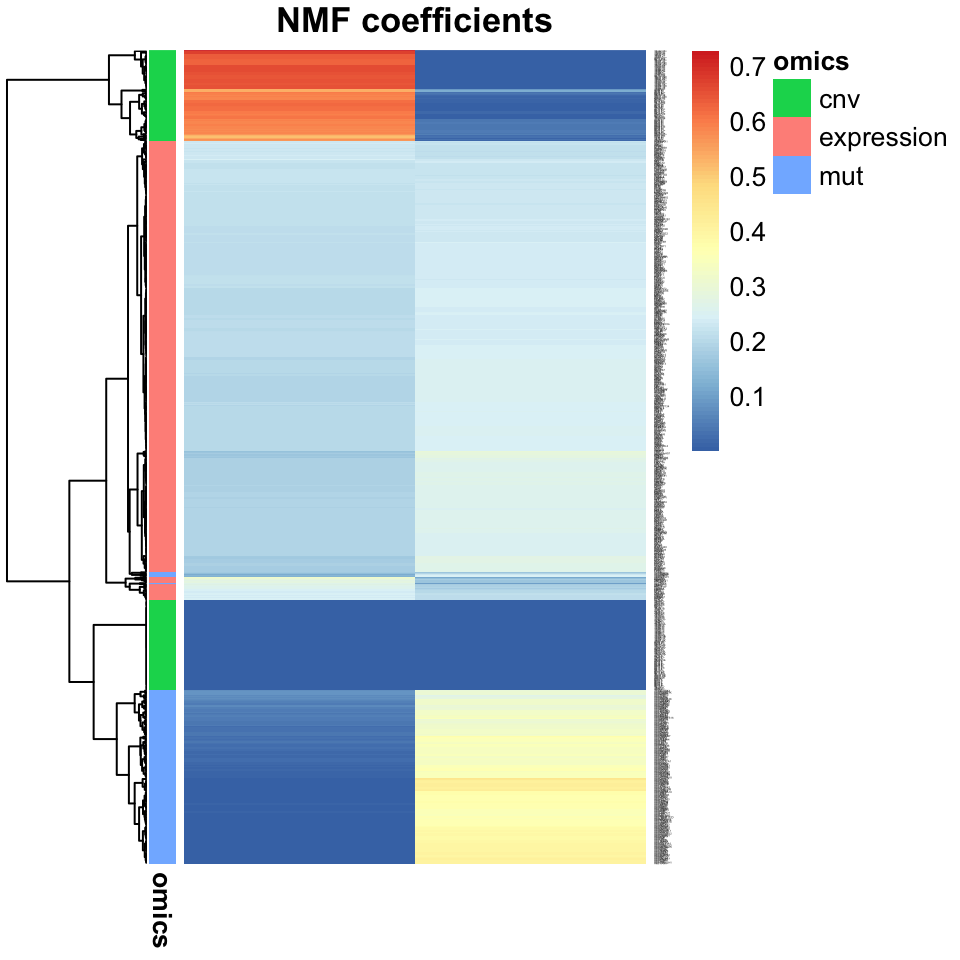
FIGURE 11.9: A heatmap of NMF factors shows separability of tumors into subtype clusters. This plot is more useful than a scatter plot when there are more than two factors.
Want to know more ?
- Joint NMF to uncover gene regulatory networks: Zhang S., Li Q., Liu J., Zhou X. J. (2011). A novel computational framework for simultaneous integration of multiple types of genomic data to identify microRNA-gene regulatory modules. Bioinformatics 27, i401–i409. 10.1093/bioinformatics/btr206 https://www.ncbi.nlm.nih.gov/pmc/articles/PMC3117336/
- Joint NMF for cancer research: Zhang S., Liu C.-C., Li W., Shen H., Laird P. W., Zhou X. J. (2012). Discovery of multi-dimensional modules by integrative analysis of cancer genomic data. Nucleic Acids Res. 40, 9379–9391. 10.1093/nar/gks725 https://www.ncbi.nlm.nih.gov/pmc/articles/PMC3479191/
11.3.3 iCluster
iCluster takes a Bayesian approach to the latent variable model. In Bayesian statistics, we infer distributions over model parameters, rather than finding a single maximum-likelihood parameter estimate. In iCluster, we model the data as
\[ X_{(i)} = W_{(i)}Z + \epsilon_i, \]
where \(X_{(i)}\) is a data matrix from a single omics platform, \(W_{(i)}\) are model parameters, \(Z\) is a latent variable matrix, and is shared among the different omics platforms, and \(\epsilon_i\) is a “noise” random variable, \(\epsilon \sim N(0,\Psi)\), with \(\Psi = diag(\psi_1,\dots \psi_M)\) is a diagonal covariance matrix.
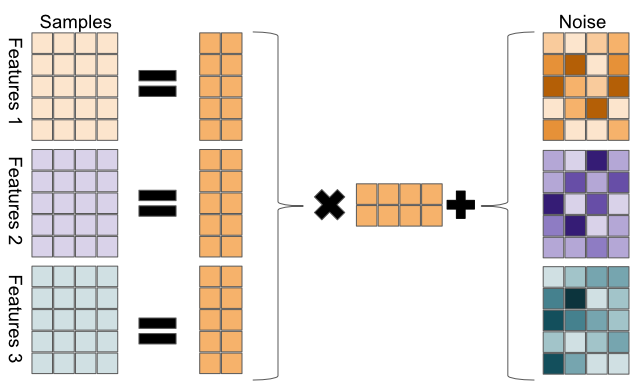
FIGURE 11.10: Sketch of iCluster model. Each omics datatype is decomposed to a coefficient matrix and a shared latent variable matrix, plus noise.
Note that with this construction, the omics measurements \(X\) are expected to be the same for samples with the same latent variable representation, up to Gaussian noise. Further, we assume a Gaussian prior distribution on the latent variables \(Z \sim N(0,I)\), which means we assume \(X_{(i)} \sim N \big( 0,W_{(i)} W_{(i)}^T + \Psi_{(i)} \big)\). In order to find suitable values for \(W\), \(Z\), and \(\Psi\), we can write down the multivariate normal log-likelihood function and optimize it. For a multivariate normal distribution with mean \(0\) and covariance \(\Sigma\), the log-likelihood function is given by
\[ \ell = -\frac{1}{2} \bigg( \ln (|\Sigma|) + X^T \Sigma^{-1} X + k\ln (2 \pi) \bigg) \]
(this is simply the log of the Probability Density Function of a multivariate Gaussian). For the multi-omics iCluster case, we have \(X=\big( X_{(1)}, \dots, X_{(L)} \big)^T\), \(W = \big( W_{(1)}, \dots, W_{(L)} \big)^T\), where \(X\) is a multivariate normal with \(0\)-mean and \(\Sigma = W W^T + \Psi\) covariance. Hence, the log-likelihood function for the iCluster model is given by:
\[ \ell_{iC}(W,\Sigma) = -\frac{1}{2} \bigg( \sum_{i=1}^L \ln (|\Sigma|) + X^T\Sigma^{-1}X + p_i \ln (2 \pi) \bigg) \]
where \(p_i\) is the number of features in omics data type \(i\). Because this model has more parameters than we typically have samples, we need to push the model to use fewer parameters than it has at its disposal, by using regularization. iCluster uses Lasso regularization, which is a direct penalty on the absolute value of the parameters. I.e., instead of optimizing \(\ell_{iC}(W,\Sigma)\), we will optimize the regularized log-likelihood:
\[ \ell = \ell_{iC}(W,\Sigma) - \lambda\|W\|_1. \]
The parameter \(\lambda\) acts as a dial to weigh the trade-off between better model fits (higher log-likelihood) and a sparser model, with more \(w_{ij}\)s set to \(0\), which gives models which generalize better and are more interpretable.
In order to solve this problem, iCluster employs the Expectation Maximization (EM) algorithm. The full details are beyond the scope of this textbook. We will introduce a short sketch instead. The intuition behind the EM algorithm is a more general case of the k-means clustering algorithm (Chapter 4). The basic EM algorithm is as follows.
- Initialize \(W\) and \(\Psi\).
- Until convergence of \(W\), \(\Psi\)
- E-step: Calculate the expected value of \(Z\) given the current estimates of \(W\) and \(\Psi\) and the data \(X\).
- M-step: Calculate maximum likelihood estimates for the parameters \(W\) and \(\Psi\) based on the current estimate of \(Z\) and the data \(X\).
11.3.3.1 iCluster+: Extending iCluster
iCluster+ is an extension of the iCluster framework, which allows for omics types to arise from distributions other than a Gaussian. While normal distributions are a good assumption for log-transformed, centered gene expression data, it is a poor model for binary mutations data, or for copy number variation data, which can typically take the values \((-2, 1, 0, 1, 2)\) for heterozygous / monozygous deletions or amplifications. iCluster+ allows the different \(X\)s to have different distributions:
- for binary mutations, \(X\) is drawn from a multivariate binomial
- for normal, continuous data, \(X\) is drawn from a multivariate Gaussian
- for copy number variations, \(X\) is drawn from a multinomial
- for count data, \(X\) is drawn from a Poisson.
In that way, iCluster+ allows us to explicitly model our assumptions about the distributions of our different omics data types, and leverage the strengths of Bayesian inference.
Both iCluster and iCluster+ make use of sophisticated Bayesian inference algorithms (EM for iCluster, Metropolis-Hastings MCMC for iCluster+), which means they do not scale up trivially. Therefore, it is recommended to filter down the features to a manageable size before inputting data to the algorithm. The exact size of “manageable” data depends on your hardware, but a rule of thumb is that dimensions in the thousands are ok, but in the tens of thousands might be too slow.
11.3.3.2 Running iCluster+
iCluster+ is available through the Bioconductor package iClusterPlus. The following code snippet demonstrates how it can be run with two components:
# run the iClusterPlus function
r.icluster <- iClusterPlus::iClusterPlus(
  t(x1), # Providing each omics type
  t(x2),
  t(x3),
  type=c("gaussian", "binomial", "multinomial"), # Providing the distributions
  K=2, # provide the number of factors to learn
  alpha=c(1,1,1), # as well as other model parameters
  lambda=c(.03,.03,.03))

# extract the H and W matrices from the run result
# here, we refer to H as z, to keep with iCluster terminology
icluster.z <- r.icluster$meanZ
rownames(icluster.z) <- rownames(covariates) # fix the row names
icluster.ws <- r.icluster$beta

# construct a dataframe with the H matrix (z) and the cancer subtypes
# for later plotting
icp_df <- as.data.frame(icluster.z)
colnames(icp_df) <- c("dim1", "dim2")
rownames(icp_df) <- colnames(x1)
icp_df$subtype <- factor(covariates[rownames(icp_df),]$cms_label)
As with other methods, we examine the iCluster results by looking at the scatter plot in Figure 11.11 and the heatmap in Figure 11.12. Both figures show that iCluster learns two factors which nearly perfectly discriminate between tumors of the two subtypes.
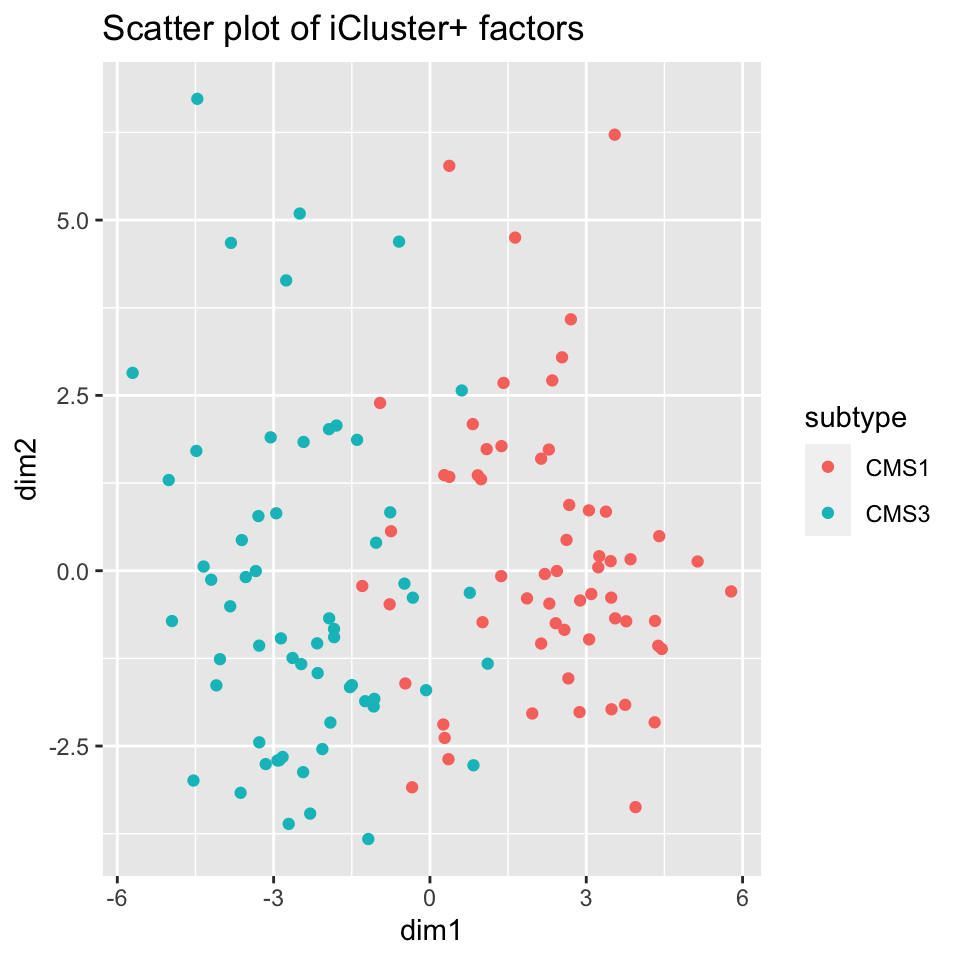
FIGURE 11.11: iCluster+ learns factors which allow tumor sub-types CMS1 and CMS3 to be discriminated.
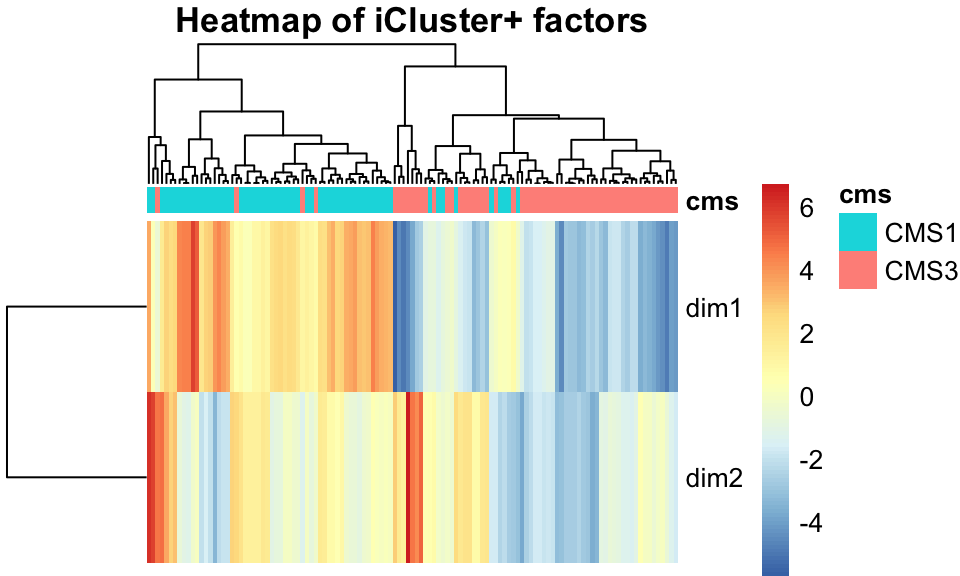
FIGURE 11.12: iCluster+ factors, shown in a heatmap, separate tumors into their subtypes well.
Want to know more ?
- Read the original iCluster paper: Shen R., Olshen A. B., Ladanyi M. (2009). Integrative clustering of multiple genomic data types using a joint latent variable model with application to breast and lung cancer subtype analysis. Bioinformatics 25, 2906–2912. 10.1093/bioinformatics/btp543 https://www.ncbi.nlm.nih.gov/pmc/articles/PMC2800366/
- Read the original iClusterPlus paper: an extension of iCluster: Shen R., Mo Q., Schultz N., Seshan V. E., Olshen A. B., Huse J., et al. (2012). Integrative subtype discovery in glioblastoma using iCluster. PLoS ONE 7:e35236. 10.1371/journal.pone.0035236 https://www.ncbi.nlm.nih.gov/pmc/articles/PMC3335101/
- Learn more about the LASSO for model regularization: Tibshirani, R. (1996). Regression shrinkage and selection via the lasso. J. Royal. Statist. Soc B., Vol. 58, No. 1, pages 267-288: http://www-stat.stanford.edu/%7Etibs/lasso/lasso.pdf
- Learn more about the EM algorithm: Dempster, A. P., et al. Maximum likelihood from incomplete data via the EM algorithm. Journal of the Royal Statistical Society. Series B (Methodological), vol. 39, no. 1, 1977, pp. 1–38. JSTOR, JSTOR: http://www.jstor.org/stable/2984875
- Read about MCMC algorithms: Hastings, W.K. (1970). Monte Carlo sampling methods using Markov chains and their applications. Biometrika. 57 (1): 97–109. doi:10.1093/biomet/57.1.97: https://www.jstor.org/stable/2334940
When dealing with categorical variables, MFA uses MCA (Multiple Correspondence Analysis). This is less relevant to biological data analysis and will not be discussed here.↩︎